Soil Sampling
Soil sampling is needed to determine soil nutrient needs and optimize fertilizer use and to assess soil variability across the field. See these guides for further information:
Nebraska Fertilizer Nitrogen Recommendations
- The Long View of Nitrogen Recommendations from Nebraska Extension
- A Bibliography of Nitrogen (N) Related Publications from the UNL Soils Faculty (1952-2019)

Nutrient Deficiencies
- Key to Nutrient Deficiencies in Soybean
- Key to Nutrient Deficiencies in Wheat and other Small Grains
- Key to Nutrient Deficiencies in Corn and Sorghum
Plant symptoms can be used to differentiate and identify crop nutrient disorders. Symptoms of nutrient deficiency vary with variety, growing conditions, and plant age. Similar symptoms may be caused by other abiotic or biotic stresses. Use these symptom keys to help identify nutrient disorders observed in Nebraska corn and sorghum, soybean, or wheat and small grains.
For more information on these and related topics, see the UNL Extension publication, Nutrient Management for Agronomic Crops in Nebraska, EC155, available online, or in soft cover through your local Extension office.
Soil Management Software
- Corn Nitrogen Recommendations Calculator New
- Maize N — A program for estimating corn N needs and in-season losses.
- Hybrid-Maize Model - A computer program for simulating corn growth and yield
- Winter Wheat Fertilizer Calculator. Use this calculator in conjunction with Fertilizing Winter Wheat, Extension Circular EC 143
- 2012 Nebraska P-Index (Excel): Instructions at Nebraska PI Documentation and Troubleshooting Guide
- Nitrogen Loss Assessment Tool (N-LAT) for Nebraska: Download this Excel tool used to estimate average N loss to leaching, volatilization, denitrification, and nitrous oxide emission for corn and soybean production. See Background Information and Users Guide for N-LAT (NebGuide G2249).
- The Value of Manure: A simple calculator (Excel) for estimating the value of manure. Corresponds with the NebGuide G1519: Calculating the Value of Manure for Crop Production
- Whole Farm Nutrient Balance(.xls) Instructions: Estimating a Whole Farm Nutrient Balance EC189
- Nutrient Inventory (Excel) Instructions: Manure Nutrient and Land Requirement Estimator EC190
- Fertilizer Use Optimization in Africa
Related Articles
")
Great Plains Biochar Conference Set for Sept. 24-26
, Nebraska Extension soil nutrient and management specialist, speaks to an attendee at the second Soil Health School at the West Central Research Extension and Education Center in North Platte. (Photo by Nicole Heldt)")
Soil Health Gap Project Setting Up Baselines and Schools for Ag Producers
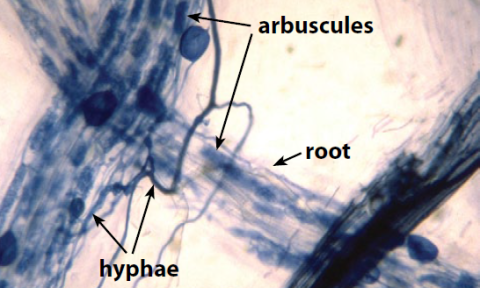
How Does Soil Life Contribute to Soil Health?
FarmBits Podcast: Technology for Soil Health, Part 2
")
Dryland Cropping Systems to be Focus of Upcoming Nebraska Soil Health School
Soil Fertility Navigation
Key to Nutrient Deficiency in Corn and Sorghum
Key to Nutrient Deficiency in Wheat
Key to Nutrient Deficiency in Soybean
Soil Management Software
Recommendations & Resources
Presentations
Related Resources
See Soil Management under specific crops for further information.
Contact
Panhandle Research & Extension Center
4502 Ave I
Scottsbluff, NE 69361-4939
(308) 632-1372
bmaharjan@unl.edu
Javed Iqbal
Keim Hall 312
Lincoln NE 68583-0915
javed.iqbal@unl.edu
402-245-1432
Free Slide Rule Offers Quick Calculation for Nitrogen Rates
 More information on how to obtain your free slide rule from CropWatch.